The labor market of the past 30 months has been more varied than any other time in recent memory. Unemployment rates swung from record lows to record highs in weeks, and then quickly fell back. Some industries that were well prepared to adjust to the pandemic economy have thrived, while others have struggled with labor shortages and supply chain issues. In recent months, inflation concerns, along with the stubborn continuation of COVID-19, have continued to weigh on the minds of economists and employers. Sounds like it’s time for us to check back in on the state of the Philadelphia labor market.
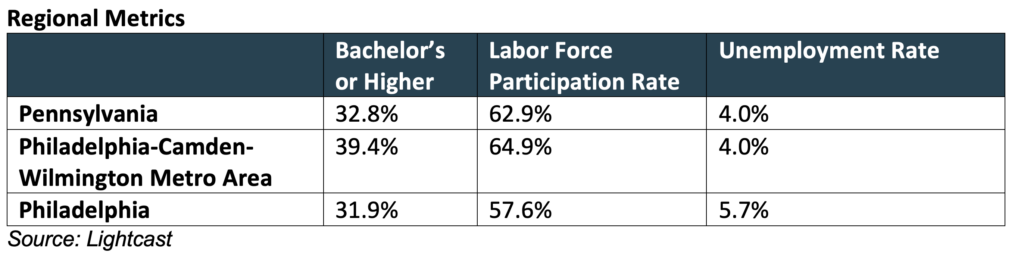
Unemployment remains stubbornly higher in Philadelphia at 5.7% compared to Pennsylvania as a whole. It stands even lower in the Philadelphia Metropolitan Area, at just 3.95%, which in turn is below even the 4.13% rate found in the tight labor market at the end of 2019. The labor force participation rate in Philadelphia also remains lower, at 57.6% in the city, compared to 64.9% in the region and 62.9% statewide. The share of the population with a bachelor’s degree or higher is also lower in the city, at 31.9%, while the region stands at 39.4%.
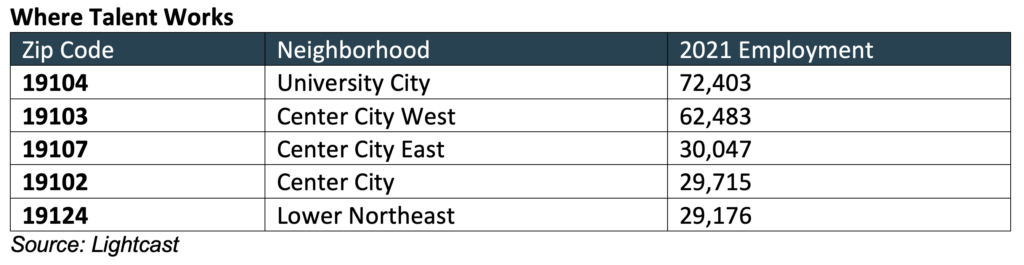
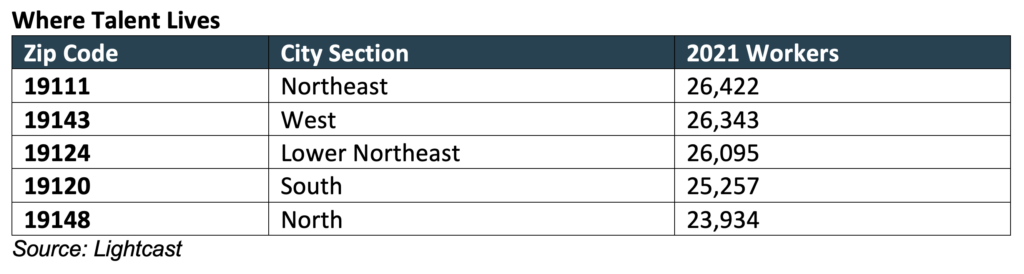
While the city as a whole lags in the region, University City continues to be a primiere employment hub, with 72,400 jobs based in the 19104 zip code alone, which accounts for more than any other zip code in the region. University City also includes one of the most populous zip codes for where talent lives, with zip code 19143 contributing more workers (26,343) to the labor force than any other zip code except 19111, located in Northeast Philadelphia. And even there, the difference is just 79 workers.
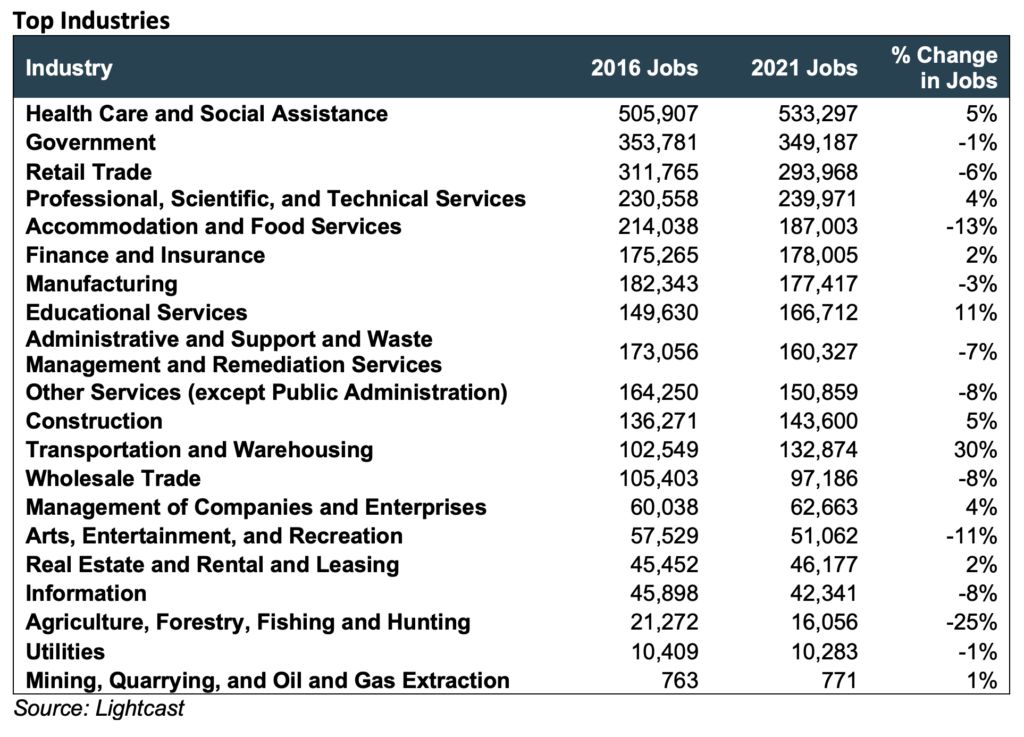
Healthcare remains the largest sector for private employment and contributes nearly twice the average national share of employment. Education is also well above national averages, demonstrating Philadelphia, and University City in particular, is a hub for “eds and meds.” Other industries that have shown strong growth in the last few years include transportation and warehousing, which adding 30,000 new jobs in the past 5 years. On the other side of the coin, Accommodation and Food Service saw the biggest decline for a large industry, with 13% fewer people working in the field since 2016. Given the disproportionate impact on COVID-19 on this industry, this is unsurprising.
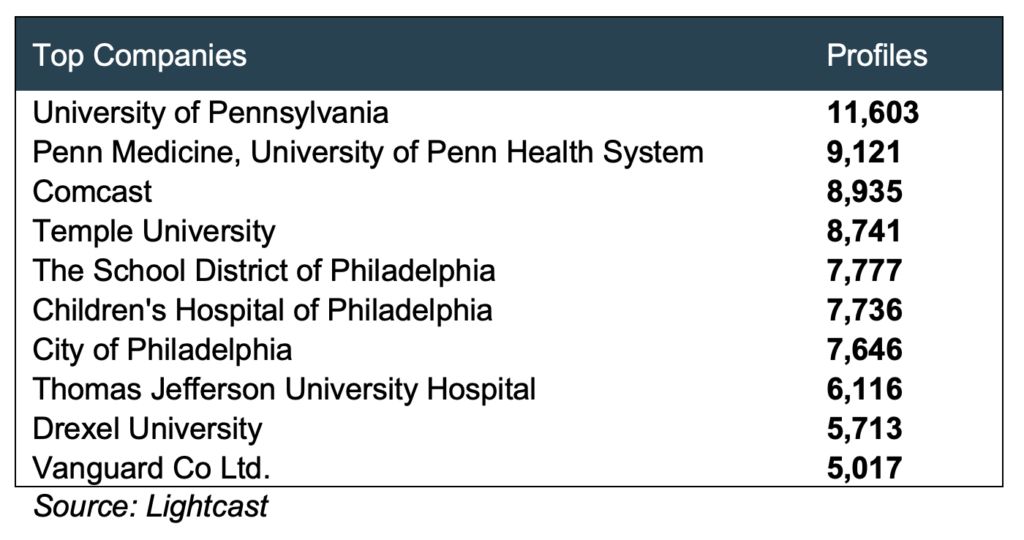
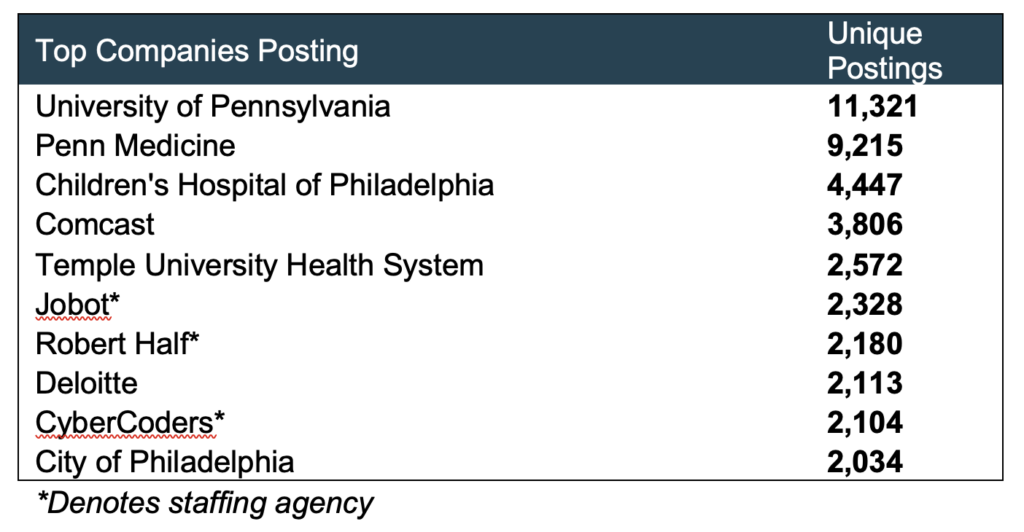
Total employment continues to be driven by the usual suspects, with the University of Pennsylvania, Penn Medicine, and Comcast leading the way, followed by other education and healthcare organizations. The University of Pennsylvania and Penn Medicine were also the top recruiters in 2021, posting nearly 20,000 jobs between them.
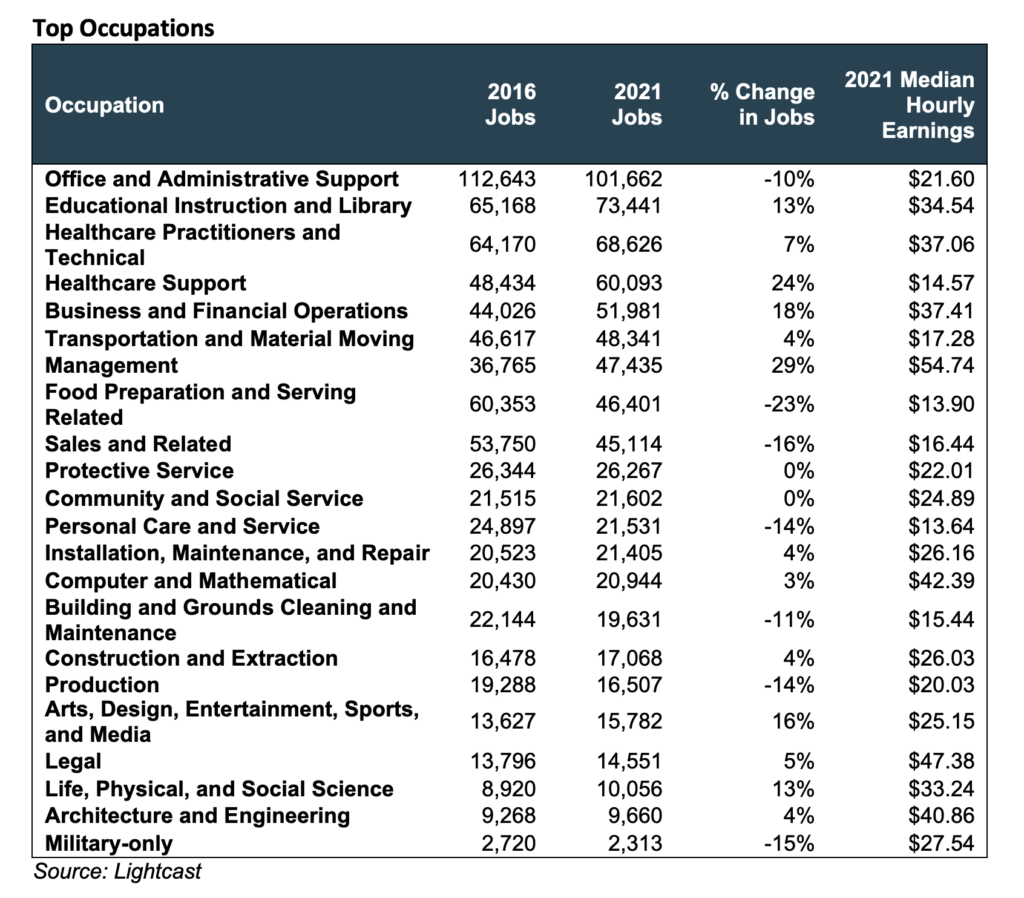
With growth in the healthcare, education, transportation, and warehousing sectors comes growth in related occupations. Management jobs grew by 23% between 2016 and 2021, followed by Healthcare Support (17%) and Business and Financial Services (18%). The number of Food Preparation and Serving jobs fell by 13,000 since 2016, or 23%, followed by a 16% decrease in Sales roles and a 14% drop in Personal Care employment. Perhaps unsurprisingly, Food Preparation and Serving and Personal Care jobs had the lowest median earnings, both under $14/hour.