Every other week, we will be publishing labor market industry (LMI) data and important trends to consider in the development of an equitable economic recovery from the COVID-19 crisis. We are always looking for opportunities to learn, grow, and collaborate. Email wpsi@universitycity.org to learn more.
It is hard to find words to describe 2020 without sounding cliché, but after years of growth, record low unemployment, and modest wage gains, the pandemic caused unprecedented labor market upheaval. With just a few weeks left in the year, this seems like a prime opportunity to compare just how different 2020 was from 2019.
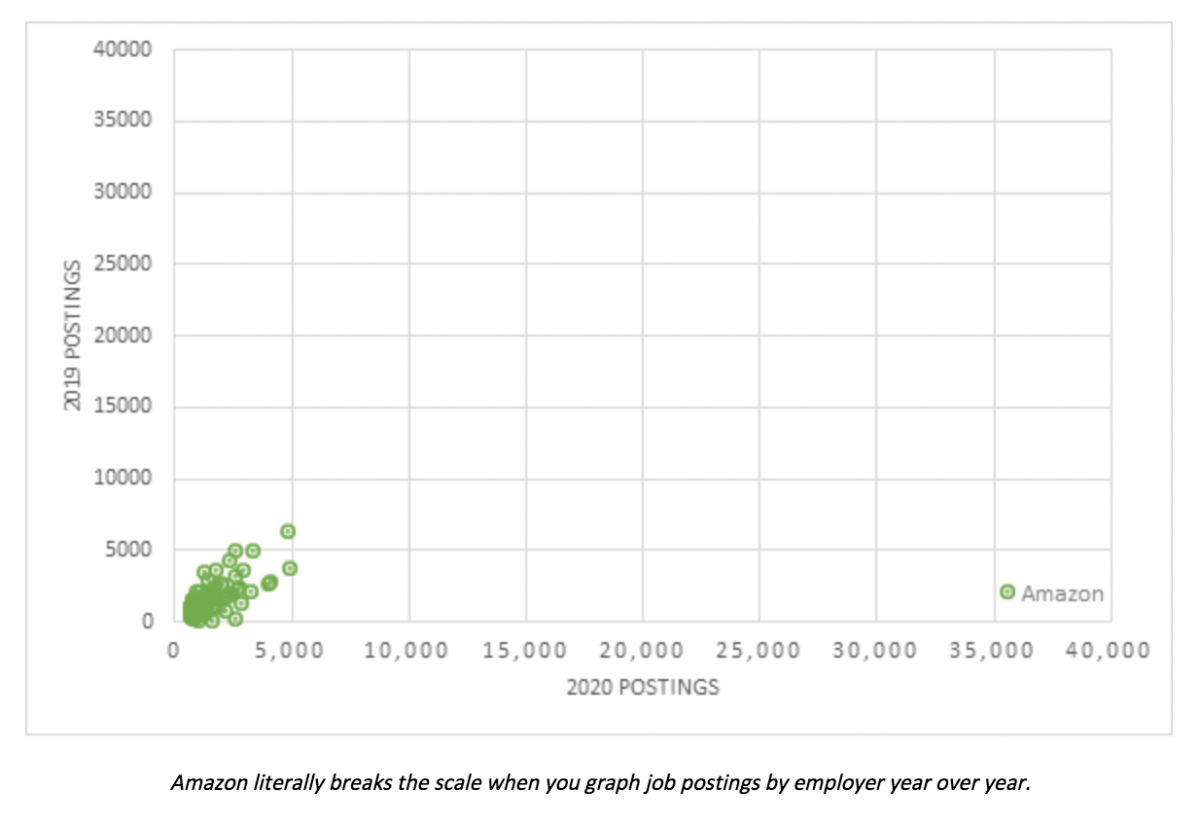
Despite everything, the number of jobs posted actually slightly increased in 2020. The Philadelphia metropolitan area saw close to 760,000 jobs posted, compared with 712,000 the prior year. However, as we have noted throughout our series of LMI updates, one company was responsible for more than 2/3rds of that increase. Amazon’s presence in our labor market has grown exponentially this year. In the first 11 months of 2019, Amazon posted just under 2,100 jobs in the region. In 2020, they posted 35,612 jobs, an 1,594% increase, representing 4.7% of all jobs posted in the region this year.
Employer | 2020 Postings | 2019 Postings | Net Change | Percentage Change |
Amazon | 35,612 | 2,098 | 33,514 | 1597.4% |
Lowe’s Companies, Inc | 4,970 | 3,670 | 1,300 | 35.4% |
Penn Medicine | 4,854 | 6,225 | -1,371 | -22.0% |
Thomas Jefferson University | 4,155 | 2,760 | 1,395 | 50.5% |
Bayada Home Health Care | 4,069 | 2,526 | 1,543 | 61.1% |
Health Care Service Corp | 3,384 | 4,928 | -1,544 | -31.3% |
Virtua Health | 3,264 | 2,034 | 1,230 | 60.5% |
University of Pennsylvania | 2,964 | 3,483 | -519 | -14.9% |
The Home Depot | 2,856 | 1,253 | 1,603 | 127.9% |
Allied Universal | 2,774 | 2,263 | 511 | 22.6% |
Amazon, along with other retailers with a large online presence, dominated the jobs market, and made occupations like “Order Fillers,” “Picker/Packers,” “Stock Clerks,” and “Material Movers” the most in-demand this year. You can also see the impacts of spending so much time at home, with significant increases in demand for roofers, masons, and loan clerks.
O*NET Code | Occupation | 2020 | 2019 | Net Change | Percentage Change |
43-5081 | Order Fillers, Wholesale and Retail Sales | 3,514 | 306 | 3,208 | 1048.4% |
53-7064 | Packers and Packagers, Hand | 3,332 | 731 | 2,601 | 355.8% |
43-5081 | Stock Clerks- Stockroom, Warehouse | 12,426 | 2840 | 9,586 | 337.5% |
43-5081 | Stock Clerks, Sales Floor | 8,551 | 2513 | 6,038 | 240.3% |
47-2181 | Roofers | 602 | 182 | 420 | 230.8% |
47-2051 | Cement Masons and Concrete Finishers | 320 | 102 | 218 | 213.7% |
53-7062 | Laborers -Freight, Stock, and Material Movers | 26,336 | 8512 | 17,824 | 209.4% |
49-3021 | Automotive Body and Related Repairers | 2,296 | 753 | 1,543 | 204.9% |
43-4131 | Loan Interviewers and Clerks | 1,605 | 657 | 948 | 144.3% |
43-5011 | Cargo and Freight Agents | 585 | 277 | 308 | 111.2% |
2020 not only shifted what kinds of jobs were in demand, it also shifted where those jobs are located. The hit to service sector employment is well documented, and a likely factor in the City of Philadelphia seeing a net decline of nearly 32,000 job postings in 2020 compared to 2019. The City is still the leading employment hub for the region, with over 250,000 jobs posted, but this decline of over 12% is significant. Meanwhile, the suburbs gained jobs, thanks to cheaper land and space for warehouse expansions for the aforementioned online shopping boom.
City | 2020 Postings | 2019 Postings | Net Change | Percentage Change |
Philadelphia, PA | 224,933 | 256,826 | -31,893 | -12.4% |
Wilmington, DE | 38,197 | 33,178 | 5,019 | 15.1% |
King Of Prussia, PA | 19,443 | 20,477 | -1,034 | -5.0% |
Newark, DE | 15,944 | 13,352 | 2,592 | 19.4% |
West Chester, PA | 13,951 | 13,788 | 163 | 1.2% |
Cherry Hill, NJ | 13,628 | 13,060 | 568 | 4.3% |
Malvern, PA | 11,490 | 12,696 | -1,206 | -9.5% |
Mount Laurel, NJ | 11,466 | 11,325 | 141 | 1.2% |
Wayne, PA | 11,184 | 12,399 | -1,215 | -9.8% |
Camden, NJ | 11,124 | 11,438 | -314 | -2.7% |
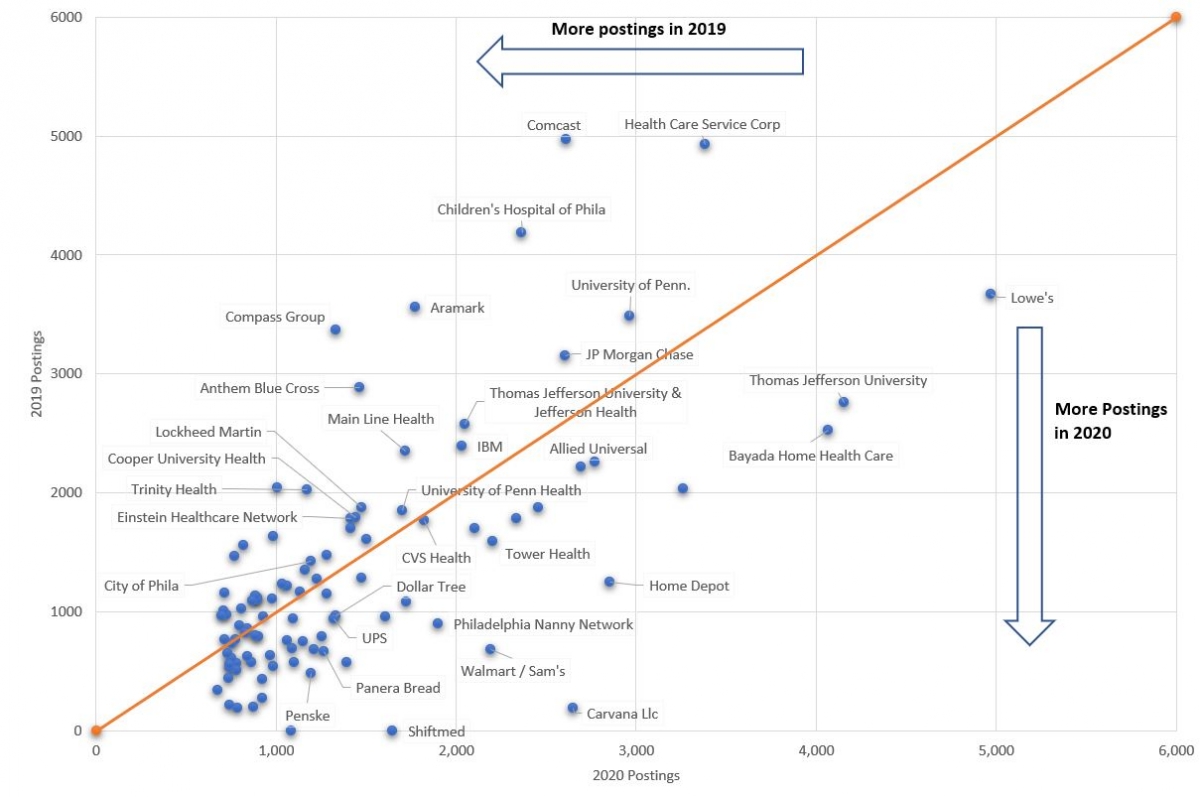
Finally, we will go back and look at how demand for talent shifted at the region’s major employers. We pulled out Amazon so the data is less skewed, and it’s easier to see where shifts occurred. The graph below shows the number of postings in 2019 on the Y axis, compared to 2020 postings on the X access. Companies further to the left of the orange line saw bigger declines in postings in 2020, while those to the right saw increases. Here we can again see the impact of rapidly changing demand, with many major health care and service providers posting fewer jobs in 2020, while retailers, home improvement stores, and home care operations increased their hiring efforts.
What does this mean for 2021? With the first vaccinations already beginning to roll out, there is hope that we will begin to return to some version of normal by mid-2021. Will consumers rush out to restaurants, book hotel rooms, and schedule the elective procedures they have been putting off? Will online shopping continue to dominate, even when we can go to stores without fear of exposing ourselves or others? When offices reopen, will workers go back, or will we begin to see a permanent shift to remote work? It is hard to say what 2021 will bring, but we certainly hope it brings more stability, better health, and more opportunity for Philadelphians to find meaningful, sustaining work.
About the data: Data is sourced from Burning Glass Technologies Labor Insights, unless otherwise noted, covering job postings in the City of Philadelphia and the Philadelphia Metro Statistical Area (MSA), which is comprised of roughly a circle surrounding Trenton, Philadelphia, King of Prussia, Camden, and Wilmington. This data is then compared to a benchmark week of February 9th – 15th, which was the last week before the economic impact of COVID-19 began to be reflected in job posting data.