Every week, we will be publishing labor market industry (LMI) data and important trends to consider in the development of an equitable economic recovery from the COVID-19 crisis. We are always looking for opportunities to learn, grow, and collaborate. Email wpsi@universitycity.org to learn more.
As the ongoing COVID-19 crisis evolves, businesses must rapidly adapt if they want to continue operations. Last week, we talked about the challenge facing workers as in-demand skills are rapidly changing. We have also looked at how some industries have adapted or even grown, while others have been forced to cut staff and have yet to show any significant rebounds. This week, we are going to explore the rapid shifts within various segments of one industry.
It comes as no surprise that the Hospitality industry (classified as Accommodation and Food Service), has been one of the hardest hit industries. Hospitality is arguably one of the most “contact intensive” industries, with jobs like restaurant servers, hotel staff, cooks, baristas, and front of house managers falling under the umbrella. In addition, the industry typically relies on people coming to a location, be it workers leaving their offices for lunch, happy hour after work, or tourists on vacation renting hotel rooms. In the Philadelphia Metro Area, the sector is typically responsible for anywhere between 6-12% of the jobs posted in any given week. While other sectors have begun to post jobs at or close to the same rates as the early part of 2020, postings in the Hospitality industry remain down 47%.
Despite these statistics, all parts of the industry have not been equally affected. Just like Amazon has used its size and logistics expertise to single-handedly stabilize the retail jobs market, hospitality employers who were already invested in “contact light” delivery methods, like order ahead, drive thru, or delivery, have been able to maintain or even grow their staffing levels.
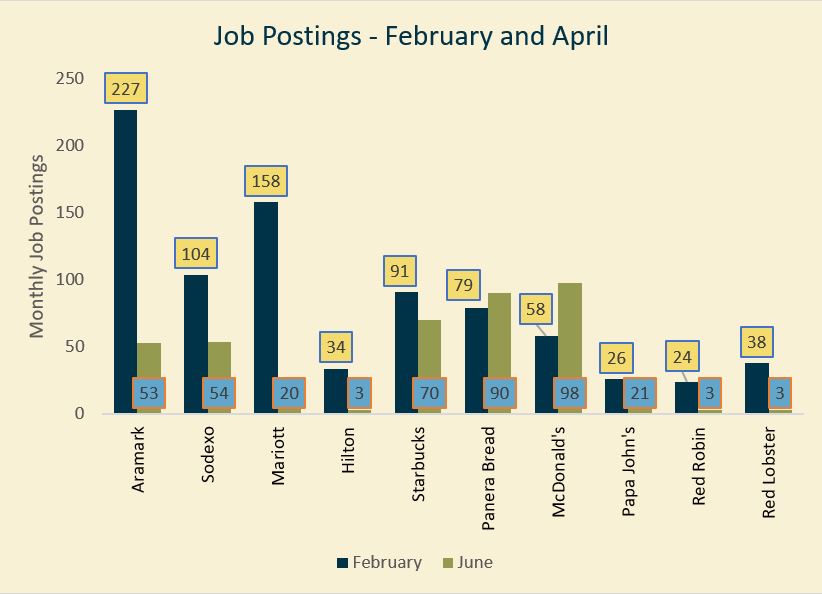
For example, Aramark and Sodexo, two giants in the food service industry that manage cafeterias, food courts, and other large-scale food service operations, have seen huge declines in job postings. Hotels have fared similarly, with Hilton and Marriott both posting 90% less jobs compared to pre-pandemic levels. With “contact light” restaurants however, companies like Starbucks, Panera Bread, McDonald’s, and Papa Johns have all been increasing their workforces as demand increases. Consumers looking for a quick bite do not need to worry about contact when they can order through an app, pick up in a lobby or outside the store, or have their meal delivered to their house or apartment. Conversely, companies that prioritize in person dining, such as Red Robin and Red Lobster, are barely posting any jobs. Instead, they are focused on rapidly adjusting their delivery models and operating structure just to continue doing business.
The ability to adapt is essential to finding opportunity, even when not in a crisis. Workers and businesses need investments, tools, and skills that help them adapt and make shifts. Programs like our West Philadelphia Skills Initiative strive to give talented workers the tools they need to adjust and grow, while investments like our Small Business Emergency Fund and Retail Restart Fund worked to help neighborhood businesses make the needed changes to continue operating. Even after this crisis fades, investments in growth and adaptability will be critical to the health of small businesses and the prosperity of the workforce.
| This Week | Change from baseline (Feb. 15th) | Chance from prior week (July 4th) | ||||
Industry, 2-digit NAICS code | Phila Metro | Phila City | Phila Metro | Phila City | Phila Metro | Phila City | |
Health Care & Social Asst. (62) | 2943 | 1027 | -32% | -30% | -15% | -12% | |
Prof, Scientific and Tech Services (54) | 1028 | 427 | -26% | -31% | 0% | -7% | |
Retail Trade (44-45) | 2277 | 206 | 51% | 11% | 3% | -5% | |
Finance & Insurance (52) | 885 | 260 | -35% | -34% | -11% | -4% | |
Accommodation & Food (72) | 774 | 197 | -28% | -49% | -47% | -45% | |
Manufacturing (31-33) | 919 | 184 | -22% | -14% | -11% | -5% | |
Admin, Support, Waste MGMT, Remediation (56) | 661 | 165 | -33% | -23% | -22% | -21% | |
Educational Services (61) | 607 | 239 | -28% | -35% | -9% | -24% | |
Transportation & Warehousing (48-49) | 1935 | 164 | 152% | 50% | 187% | 32% | |
Information (51) | 233 | 98 | -53% | -49% | -44% | -38% | |
Other Services (81) | 718 | 74 | 28% | 4% | 32% | -31% | |
Public Admin (92) | 565 | 165 | 60% | 14% | 147% | 33% | |
Real Estate & Rental Leasing (53) | 309 | 103 | 11% | -4% | -33% | -5% | |
Construction (23) | 225 | 62 | -34% | 27% | -27% | 0% | |
Arts, Entertainment & Recreation (71) | 91 | 33 | -47% | -18% | -68% | -54% | |
Wholesale Trade (42) | 40 | 6 | -50% | -57% | -45% | -97% | |
Utilities (22) | 49 | 14 | 44% | 27% | -6% | 40% | |
Mining, Quarrying, Oil & Gas Extraction (21) | 12 | 6 | -59% | -14% | -76% | -57% | |
Management, Companies & Enterprises (55) | 19 | 4 | 19% | -20% | -32% | 0% | |
Agriculture, Forestry, Fishing and Hunting (11) | 12 | 4 | -56% | -43% | -40% | 33% | |
Unspecified | 4111 | 1248 | -12% | -16% | 1% | -15% | |
Total | 18413 | 4686 | -10% | -23% | -3% | -17% | |
About the data: Data is sourced from Burning Glass Technologies Labor Insights, unless otherwise noted, covering job postings in the City of Philadelphia and the Philadelphia Metro Statistical Area (MSA), which is comprised of roughly a circle surrounding Trenton, Philadelphia, King of Prussia, Camden, and Wilmington. This data is then compared to a benchmark week of February 9th – 15th, which was the last week before the economic impact of COVID-19 began to be reflected in job posting data.