Every other week, we will be publishing labor market industry (LMI) data and important trends to consider in the development of an equitable economic recovery from the COVID-19 crisis. We are always looking for opportunities to learn, grow, and collaborate. Email wpsi@universitycity.org to learn more.
We have spent a lot of time looking at the larger industries in the Philadelphia region, and the effect that COVID-19 has had on their hiring trends. This week, we will dive into how a smaller – but still important – sector has fared.
Much has been written (including by us) about the effect that social distancing requirements have had on the Hospitality industry. Just adjacent to Hospitality is Arts, Entertainment & Recreation. Businesses operating in this industry include casinos, amusement parks, museums, performing arts companies, sports teams, and promoters. Jobs range from bartenders to actors to blackjack dealers, all of which rely on near proximity to others at work.
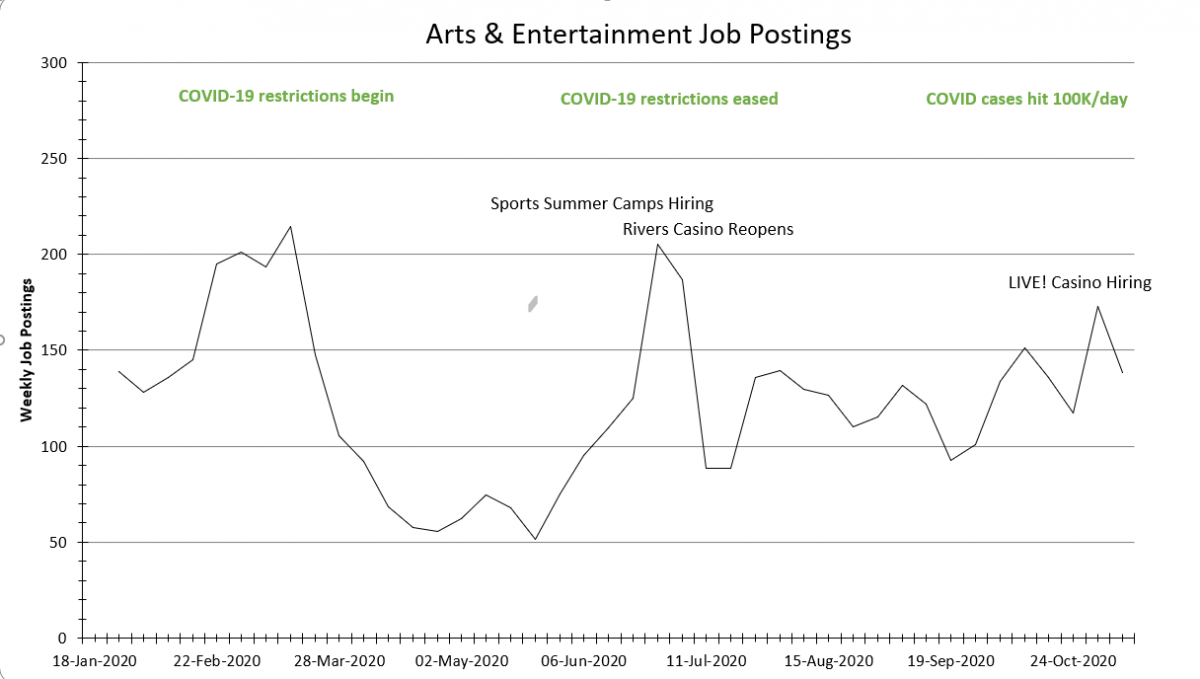
The industry in the Philadelphia area typically posted between 150 – 200 jobs each week in 2019. The end of February 2020 even saw weekly postings peak at 215. Following COVID-19 restrictions, that plummeted to just over 50 weekly postings, and stayed at those levels into June. Briefly, the re-opening of casinos and summer camps pushed numbers back up to normal levels at the beginning of the summer, but those gains did not hold. For the remainder of the summer, weekly postings stayed between 100-125 new jobs a week. Going into the winter, we saw a brief spike in postings, thanks mostly to recruiting by the soon-to-open LIVE! Casino in South Philadelphia.

However, the reduction in job postings tells only part of the story. In September 2020, the industry reported one of the highest levels of unemployment, with 23.3% of workers out of work, compared to just 5.1% in September of 2019 according to the Bureau of Labor Statistics. Even a sustained return to a normal volume of job postings will do little to reduce unemployment rates in the industry.
Until COVID-19 is under control and people feel confident in spending money on leisure activities, the Arts & Entertainment industry will be relying on outside support to survive. At University City District, we recently set up West Philly Forward, where individuals can directly support small businesses, arts & culture institutions, and non-profits from the neighborhood, either by donating to an organization’s specific campaign or making a donation to a collective fund that will be split equally. While support from government and philanthropy will also be needed, by chipping in we can help to keep the places that are in the business of making us happy open and ready to bounce back once it is safe.
| Weekly Postings, Oct 25th – Oct 31st | Percentage Change from Feb 15th | Week over Week | |||
Industry | Phila Metro | Phila City | Phila Metro | Phila City | Phila Metro | Phila City |
Health Care & Social Assistance | 2497 | 773 | -37% | -39% | 1% | -2% |
Professional, Scientific & Tech Services | 938 | 428 | -42% | -36% | -5% | 6% |
Retail Trade | 1637 | 176 | 3% | -32% | -28% | -16% |
Finance & Insurance | 995 | 306 | -31% | -41% | -7% | 6% |
Accommodation & Food Service | 745 | 201 | -33% | -65% | -15% | 6% |
Manufacturing | 1001 | 181 | -25% | -23% | 3% | 9% |
Administrative & Support & Waste Mgmt | 529 | 104 | -42% | -54% | -4% | -13% |
Educational Services | 696 | 281 | -39% | -44% | -12% | -19% |
Transportation & Warehousing | 467 | 115 | -37% | -34% | -25% | -17% |
Information | 294 | 123 | -48% | -62% | -13% | -13% |
Other Services | 238 | 65 | -49% | -14% | -35% | -3% |
Public Administration | 255 | 88 | -7% | -30% | 18% | -4% |
Real Estate & Rental Leasing | 250 | 93 | -25% | -26% | 3% | 4% |
Construction | 187 | 45 | -17% | -46% | -19% | 13% |
Arts, Entertainment & Recreation | 247 | 168 | 68% | 175% | 149% | 273% |
Wholesale Trade | 78 | 6 | 1% | -40% | 10% | -45% |
Utilities | 35 | 4 | -29% | -50% | -17% | -33% |
Mining, Quarrying and Oil & Gas | 12 | 4 | -69% | -64% | -40% | -20% |
Mgmt of Companies & Enterprises | 14 | 4 | -68% | -64% | -39% | -73% |
Agriculture, Forestry, Fishing and Hunting | 13 | 4 | -35% | -20% | 86% | 0% |
Unspecified | 3132 | 893 | -35% | -49% | -6% | 3% |
Total | 14260 | 4062 | -20% | 3% | -9% | 1% |
About the data: Data is sourced from Burning Glass Technologies Labor Insights, unless otherwise noted, covering job postings in the City of Philadelphia and the Philadelphia Metro Statistical Area (MSA), which is comprised of roughly a circle surrounding Trenton, Philadelphia, King of Prussia, Camden, and Wilmington. This data is then compared to a benchmark week of February 9th – 15th, which was the last week before the economic impact of COVID-19 began to be reflected in job posting data.
