Back in early 2020, we started sharing weekly labor market trends as COVID-19 began to significantly disrupt normal hiring patterns. Nearly two years after the first cases were detected in the US, we have a much better picture of the long-term impacts on jobs in our region.
The labor market in 2021 was much different than that of 2020. 2020 was marked by wild shifts in demand for workers, harsh lockdowns, and rapid shifts to remote work. 2021 certainly had its share of disruptions, but with fewer extremes and a strong increase in demand for talent as industries rebounded. Utilizing EMSI/Burning Glass Labor Insights, we looked at who was doing the most recruiting in 2021, and in many ways, the list looks a lot like the top employers in 2019.
A year ago, we wrote about the outsized influence online retail, particularly Amazon, had on the labor market in 2020. This leveled out some in 2021. While Amazon still posted nearly 3 times as many openings in 2021 as it did in 2019, it was a far cry from its staggering 2020 totals. Establishments with retail storefronts saw some of the largest gains in 2021 in the Philadelphia region, including businesses like JP Morgan Chase, CVS, Boston Market, Wells Fargo, and TJX Companies more than doubling their job postings compared to 2019.
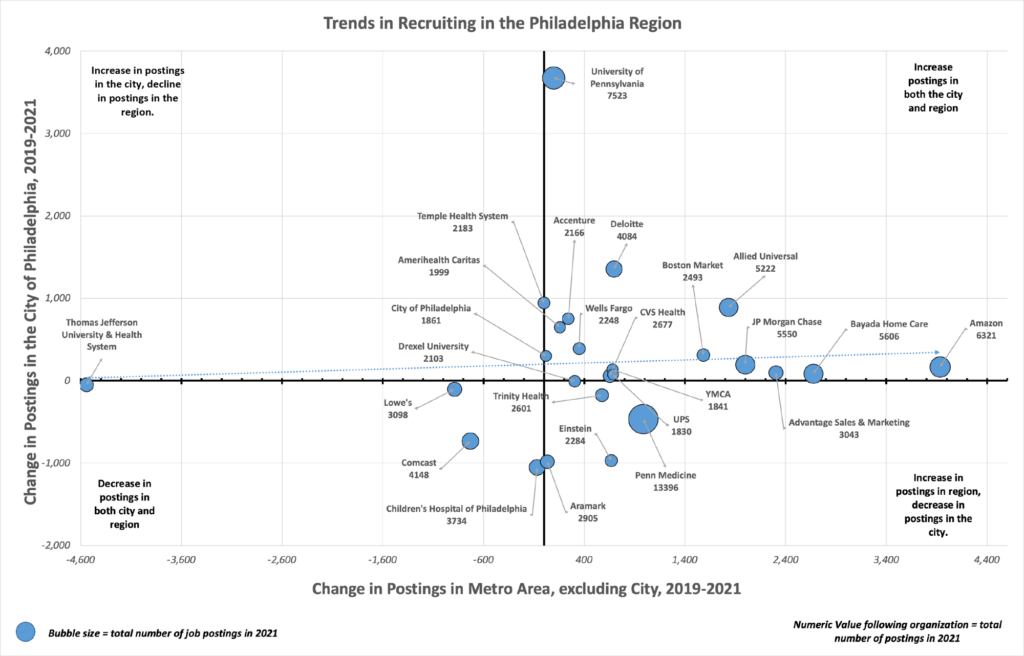
Another trend worth noting is a shift in where jobs are located. While University City is home to 4 of the top 20 organizations for job postings, the city of Philadelphia as a whole saw less job growth in 2021 than the surrounding suburban counties. Increases in job postings from Amazon, Bayada Home Care, JP Morgan Chase, and even Penn Medicine were concentrated in the surrounding region.
The chart below plots this for the top 25 organizations by job postings in the region in 2021. The X-axis shows the change in job postings in the city between 2019-2021 by organization. On the left side of 0 means that organization posted fewer jobs in 2021 than 2019, and if they fall on the right side of 0 it means they posted more means more. The same applies to the Y-axis, except that is for the region, excluding postings in the city. Postings above 0 indicate growth between 2019 and 2021 while falling below 0 indicates a decrease. The size of the bubble represents the total number of jobs posted in 2021 – a bigger bubble means more total job postings.
For example, we can see that an organization like the University of Pennsylvania posted 7,523 jobs in 2021, a large increase over 2019, and those jobs were concentrated almost exclusively within the city limits. Amazon posted 6,321 jobs in the region in 2021, and those jobs were concentrated almost exclusively in the surrounding region. Comcast posted fewer jobs in both the city and the surrounding region in 2021, indicated by its position in the lower left-hand quadrant.

If there was equal growth in jobs between the top employers in the suburbs and in the city, the trendline would run at a 45-degree angle from the bottom left to the upper right. The trend line here is closer to flat, indicating job posting growth in the surrounding region is outpacing that in the city.
If this shift is the start of a broader trend remains unclear. Employers posted record numbers of jobs in 2021 across the board, so 2021 may prove to be yet another outlier that fades away in 2022. However, lopsided growth between Philadelphia and its surrounding towns and cities is of some concern, at a time when the city is finally growing in population after years of decline. We will continue watching these trends throughout the year.
