Every week, we will be publishing labor market industry (LMI) data and important trends to consider in the development of an equitable economic recovery from the COVID-19 crisis. We are always looking for opportunities to learn, grow, and collaborate. Email wpsi@universitycity.org to learn more.
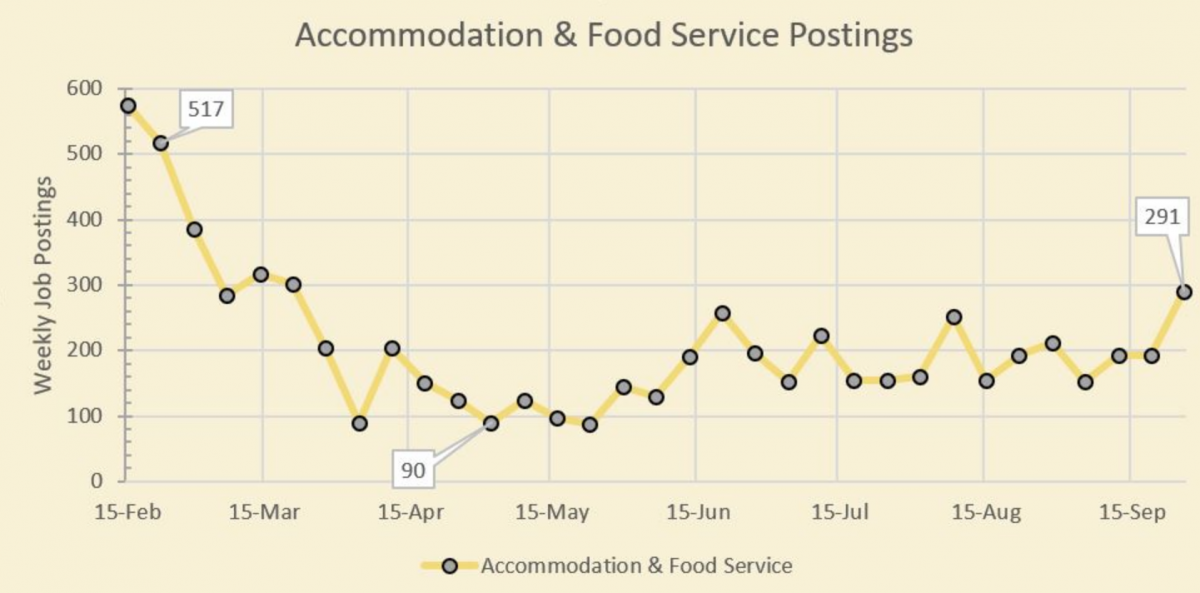
Of all the industries disrupted by the pandemic, it’s safe to say that the hospitality industry has been hit the hardest. In the spring, mandated closures caused an immediate halt on demand for hotel rooms and restaurants, while remote working and schooling evaporated traffic at coffee shops and lunch spots. The list of permanent closures in Philadelphia continues to grow, leaving industry workers seeking employment with few options.
Fortunately, there is a glimmer of hope. Last week, indoor dining capacity limits increased to 50% within the city of Philadelphia. Many establishments have expanded their outdoor dining, ether on wide sidewalks or in parking spaces adjacent to storefronts. In addition to bringing life to quieted streets, WHYY reported this week that these efforts have boosted restaurants’ recovery.
All of this has led to the first positive jobs news in the industry since the beginning of the year. Last week, in preparation for expanded indoor dining, hospitality job postings in Philadelphia increased more than 30%. Nearly all this growth came from restaurants and other eating establishments. Moreover, those gains are not concentrated with any one company. Aramark and Sodexo, two leading foodservice companies, combined to post just 16.4% of the opportunities in the industry, with the 97% of establishments seeking to fill 1-5 positions. This diversity points to a general sense of optimism in the industry, which draws a contrast to the retail sector, where nearly all growth is credited to Amazon’s continued domination in online sales.
With cold weather setting in and cases rising in parts of the country, this optimism may not last. That said, efforts by communities, business associations, government and industry workers, and companies have helped to keep some of the worst predictions from early in the year from materializing.
For an up-to-date list of restaurants and their status for takeout, delivery, and outdoor dining in University City, follow the UCD Dining Days webpage.
| Weekly Postings, Sept 27th – 3rd | Percentage Change from Feb 15th | Week over Week | |||
Industry | Phila Metro | Phila City | Phila Metro | Phila City | Phila Metro | Phila City |
Health Care & Social Assistance | 2616 | 794 | -34% | -81% | 27% | 4% |
Professional, Scientific & Tech Services | 1109 | 382 | -32% | -43% | 13% | 0% |
Retail Trade | 4109 | 275 | 160% | 6% | -29% | -32% |
Finance & Insurance | 1140 | 344 | -21% | -34% | 3% | -1% |
Accommodation & Food Service | 1303 | 291 | 18% | -49% | 59% | 52% |
Manufacturing | 1007 | 174 | -25% | -26% | -2% | -3% |
Administrative & Support & Waste Mgmt | 836 | 181 | -8% | -20% | 37% | 29% |
Educational Services | 623 | 194 | -45% | -61% | -6% | -37% |
Transportation & Warehousing | 725 | 172 | -3% | -2% | -3% | 32% |
Information | 269 | 99 | -52% | -70% | -27% | -24% |
Other Services | 277 | 46 | -41% | -39% | -27% | -31% |
Public Administration | 213 | 61 | -22% | -51% | 0% | -22% |
Real Estate & Rental Leasing | 238 | 72 | -29% | -42% | -12% | -16% |
Construction | 236 | 47 | 5% | -43% | -14% | -36% |
Arts, Entertainment & Recreation | 167 | 112 | 14% | 84% | 65% | 220% |
Wholesale Trade | 103 | 5 | 34% | -50% | 21% | -58% |
Utilities | 25 | 2 | -49% | -75% | -49% | -33% |
Mining, Quarrying and Oil & Gas | 25 | 3 | -36% | -73% | 19% | -57% |
Mgmt of Companies & Enterprises | 24 | 14 | -45% | 27% | -8% | 40% |
Agriculture, Forestry, Fishing and Hunting | 11 | 1 | -45% | -80% | -21% | 0% |
Unspecified | 3931 | 1175 | -19% | -33% | 6% | 1% |
Total | 18987 | 4444 | -9% | -37% | -7% | -6% |
About the data: Data is sourced from Burning Glass Technologies Labor Insights, unless otherwise noted, covering job postings in the City of Philadelphia and the Philadelphia Metro Statistical Area (MSA), which is comprised of roughly a circle surrounding Trenton, Philadelphia, King of Prussia, Camden, and Wilmington. This data is then compared to a benchmark week of February 9th – 15th, which was the last week before the economic impact of COVID-19 began to be reflected in job posting data.