Every week, we will be publishing labor market industry (LMI) data and important trends to consider in the development of an equitable economic recovery from the COVID-19 crisis. We are always looking for opportunities to learn, grow, and collaborate. Email wpsi@universitycity.org to learn more.
Throughout the COVID-19 pandemic, we have looked at how some jobs and industries have grown rapidly, while others have quickly declined. This week, we are going to look closely at how one particular slice of the labor market has changed since last year.
At the West Philadelphia Skills Initiative, we partner with employers seeking talent to fill roles that usually do not require a bachelor’s degree. Often, we find lower market pay rates associated with these jobs than those that require a BA- although that gap has been shrinking and varies greatly across industries and occupations. Just because a job does not require a 4-year college degree does not, of course, mean the job is easy to perform or doesn’t require a high level of skill. This has become even more evident since COVID-19, as many of the jobs deemed essential fall into the “Sub-Bachelor” or “Sub-BA.”
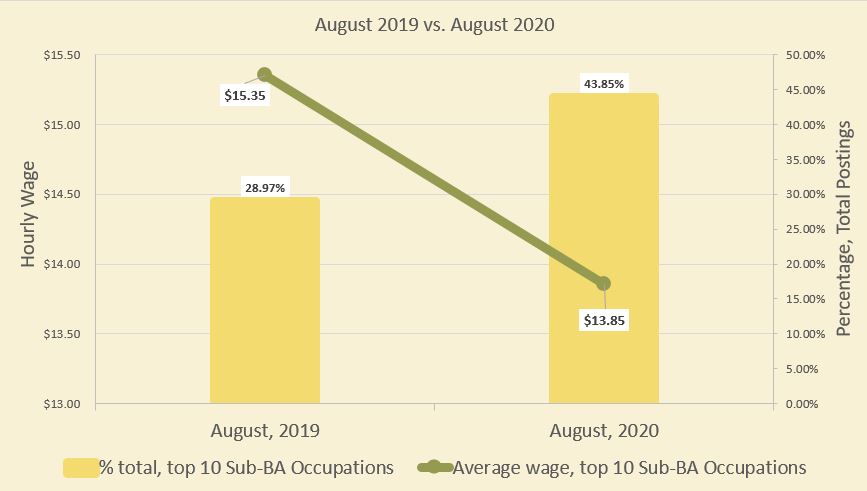
While the work is essential, there are some concerning patterns emerging around the concentration of Sub-BA job postings, and the wages those jobs typically offer. In August of 2019, the top 10 Sub-BA occupations in the Philadelphia Metro Area represented about 29% of all the Sub-BA job postings that month. Those jobs paid an average of $15.35/hour, an all-time high. Unfortunately, this trend has reversed in 2020. This past month, the top 10 Sub-BA occupations made up nearly 44% of all Sub-BA job postings – almost 29,000 job postings concentrated in just ten occupations. At the same time, the average hourly wage fell to just $13.85.
This level of concentration is concerning since a shift in optimism in one of these ten occupations could have outsized effects on the job market. However, when we dig deeper into what comprises those top 10 Sub-BA occupations, the level of concentration goes up even further. In the chart below, the top 10 Sub-BA Occupations for August 2020 are listed from left to right, in descending order by average hourly wage. The yellow bar represents the number of jobs posted in that occupation in August 2019, while the blue bar represents August 2020.
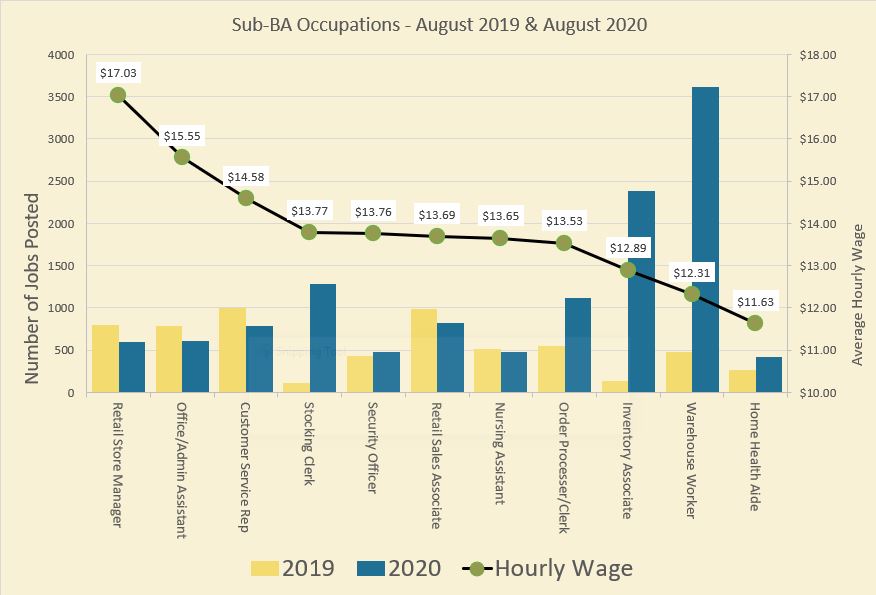
We can clearly see that most of the growth in Sub-BA jobs in 2020 is concentrated in a handful of occupations – primarily Warehouse Workers and Inventory Associates. The two highest wage occupations – Retail Store Managers and Office/Administrative Assistants – have declined as retail storefronts and offices remain closed or at reduced capacity.
As we have noted previously, any job growth during a global pandemic is good news in the short term. However, the concentration of work – especially low wage work – is a sign that we should not take headlines highlighting a recovery at face value. Companies who are rapidly expanding their warehouse and logistics staff should be thinking about what kind of work they will have once social distancing measures are no longer needed. Policymakers should consider the potential for more rapid shifts in labor market demand and make available resources to help smooth that transition for workers.
Finally, workforce development and training organizations should begin to think about the steps we can take to recognize the skills and talents workers in these jobs have developed, and how those can be applied to emerging opportunities. Concentration is helping to keep unemployment lower than expected in the midst of a pandemic, but a more diverse labor market will be critical to the long-term health of the Philadelphia region’s economy.
Industry | Weekly Postings, Sept. 13th – 19th | Percentage Change from Feb 15th | Week over Week | |||
| Phila Metro | Phila City | Phila Metro | Phila City | Phila Metro | Phila City |
Health Care & Social Assistance | 2660 | 735 | -33% | -81% | 27% | 4% |
Professional, Scientific & Tech Services | 980 | 425 | -40% | -74% | 25% | 26% |
Retail Trade | 4259 | 278 | 169% | -82% | 38% | -4% |
Finance & Insurance | 811 | 207 | -44% | -86% | 6% | 3% |
Accommodation & Food Service | 657 | 192 | -41% | -83% | -12% | 26% |
Manufacturing | 1057 | 166 | -21% | -88% | 36% | 27% |
Administrative & Support & Waste Mgmt | 480 | 96 | -47% | -89% | 9% | -8% |
Educational Services | 722 | 297 | -37% | -74% | 42% | 28% |
Transportation & Warehousing | 787 | 108 | 6% | -85% | 96% | -17% |
Information | 372 | 114 | -34% | -80% | 88% | 43% |
Other Services | 352 | 63 | -25% | -87% | 21% | 26% |
Public Administration | 270 | 92 | -1% | -66% | 40% | 16% |
Real Estate & Rental Leasing | 208 | 76 | -38% | -77% | 15% | 19% |
Construction | 281 | 61 | 25% | -73% | 104% | 91% |
Arts, Entertainment & Recreation | 101 | 40 | -31% | -73% | 20% | 25% |
Wholesale Trade | 63 | 8 | -18% | -90% | 40% | 0% |
Utilities | 64 | 4 | 31% | -92% | 156% | 0% |
Mining, Quarrying and Oil & Gas | 27 | 4 | -31% | -90% | -10% | -56% |
Mgmt of Companies & Enterprises | 15 | 9 | -66% | -80% | -12% | 125% |
Agriculture, Forestry, Fishing and Hunting | 18 | 2 | -10% | -90% | 20% | -33% |
Unspecified | 3203 | 868 | -34% | -82% | 8% | -7% |
Total | 17387 | 3845 | -17% | -82% | 26% | 7% |
About the data: Data is sourced from Burning Glass Technologies Labor Insights, unless otherwise noted, covering job postings in the City of Philadelphia and the Philadelphia Metro Statistical Area (MSA), which is comprised of roughly a circle surrounding Trenton, Philadelphia, King of Prussia, Camden, and Wilmington. This data is then compared to a benchmark week of February 9th – 15th, which was the last week before the economic impact of COVID-19 began to be reflected in job posting data.